The information below provides an overview of the reporting and metrics available in Project Analytics for Project Executives. The pages have been configured to use Quarters; however, Period could have been configured as the ‘time grain’ instead. The information on each tab in the Project Executive area has been taken from the Dashboard Index. Additional information below each of the screenshots describes details of the metrics and functionality within each interactive dashboard page.
Project Executive
Screenshots of the default dashboard for each tab within the Project Management reporting area are shown below. Results in the dashboards can be filtered using the parameters at the top of each dashboard (Fiscal Year, Fiscal Quarter, Fiscal Period, PA Period, Business Unit, Organization, Project Manager Name, Project Class, Project Type, Program Name, Project Name, and Service Type). Additional query modifications are available using the ‘Modify’ link.
2.1 – Overview
Provides the default aggregated view of information for all the organizations satisfying the dashboard filter criteria, with the ability to drill down to project details that each organization is responsible for. In addition, this dashboard page provides a quick overview of Inception-to-date performance, variances, and the number of projects each organization is executing and their profitability and cost performance.
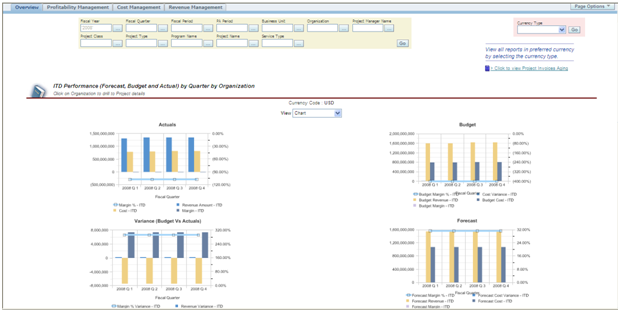
ITD Performance (Forecast, Budget, and Actual) by Quarter, and Organization uses Views (Chart, ITD Data, and ITD Variance) to display the information. In addition, you can drill thru to Project Invoice Aging and Project Commitments. The graphs include ITD Margin %, Cost, Revenue Margin, Forecast Cost, Forecast Revenue, Forecast Margin, and Forecast Variance.
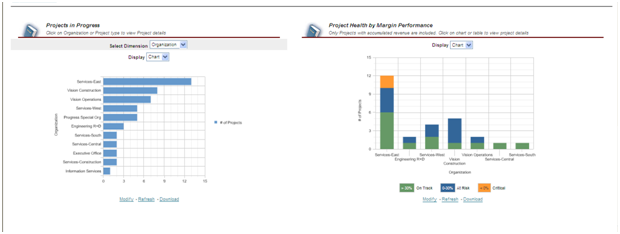
Projects in Progress uses Dimensions (Organization and Project Type) to display the number of ongoing projects (Chart or Table). Changing the dimension changes the display for the adjacent charts and those listed immediately below. Project Health by Margin Performance Displays (Chart or Table) the health of the projects with accumulated revenue (On Track, At Risk, Critical).
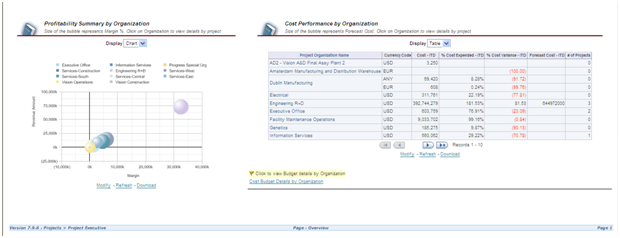
Profitability Summary by Organization Displays (Chart or Table) the margin percentages of the projects. Revenue Amounts and Margin Amounts represent the axes of the graph. Cost Performance by Organization Displays (Chart or Table) Percentage Cost Variance by the Dimension selected. You can drill thru to Cost Budget Details by Organization.
2.2 – Profitability Management
Provides detailed profitability information for the organizations and the projects under the organizations with the ability to drill down to projects, tasks, and resources. In addition, it compares the profitability to the budgets and forecasts and period-over-period changes in the margin, including trending with the ability to drill down to the project, task, and resource details.
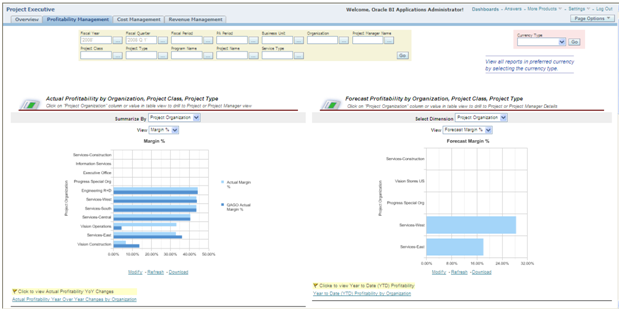
Actual Profitability by Organization, Project Class, Project Type allows you to report by Project Organization (shown above), Project Class, Project Type, or Program. You can view the information by Margin Percentage, Revenue, Cost, and Data. Above, the Actual Margin Percentage is compared to QAGO (one-quarter prior) and Actual Margin. You can drill thru to Actual Profitability Year Over Year by Organization.
Forecast Profitability by Organization, Project Class, and Project Type allow you to report by Project Organization (above), Project Type, Project Class, and Program Name. The Forecast Margin Percentage by Project Organization is displayed above. In addition, you can drill thru to YTD Profitability by Organization.
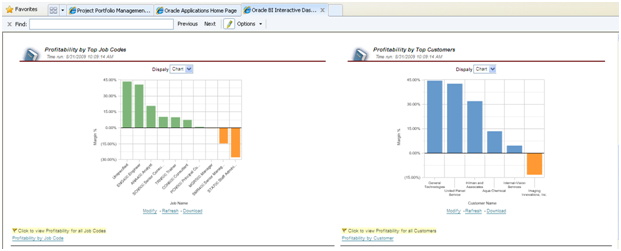
Profitability by Top Job Codes Displays (Chart or Table) Margin Percentages for all the Top Job Codes. You can click the link to view the Profitability for all Job Codes.
Profitability by Top Customers Displays (Chart or Table) Margin Percentages for the top customers. You can display profitability for all Customers as well.
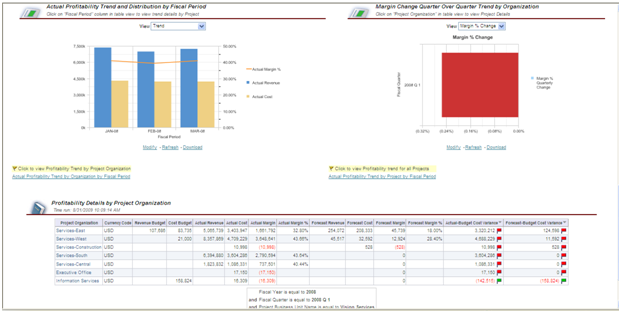
Actual Profitability Trend by Fiscal Period uses Views (Trend, Revenue Distribution, Cost Distribution, Margin Distribution, and Data to report Actual Margin Percentage, Actual Revenue, and Actual Cost. Margin Change Quarter Over Quarter Trend by Organization uses Views (Margin Percentage Change, Margin Change, and Data) to report quarterly margin changes.
Profitability Details by Project Organization Summarizes (Project Organization, Project Class, Project Type, or Program) Revenue Budget, Cost Budget, Actual Revenue, Actual Cost, Actual Margin, Actual Margin Percentage, Forecast Revenue, Forecast Cost, Forecast Margin, Actual/Cost Budget Variance, and Forecast/Budget Cost Variance.
2.3 – Cost Management
Provides detailed cost information for the organizations and the projects under the organizations with the ability to drill down to projects, tasks, and resources. In addition, it provides the cost comparisons of organizations, programs, expenditure categories, and cost variances by top projects and top resources, including trending with the ability to drill down to details.
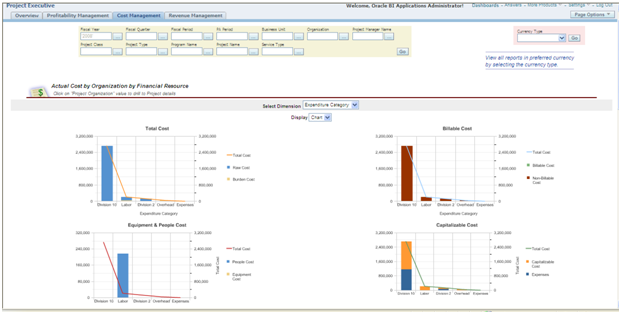
Actual Cost by Organization by Financial Resource uses Dimensions (Expenditure Category, Project organization, Project Type, Program, and Supplier Name to Display (Chart or Table) Total Cost, Raw Cost, Burden Cost, People Cost, Equipment Cost, Billable Cost, Non-Billable Cost, Capitalizable Costs and Expenses. You can also drill thru to Actual Efforts by Organizations with Financial Resources.
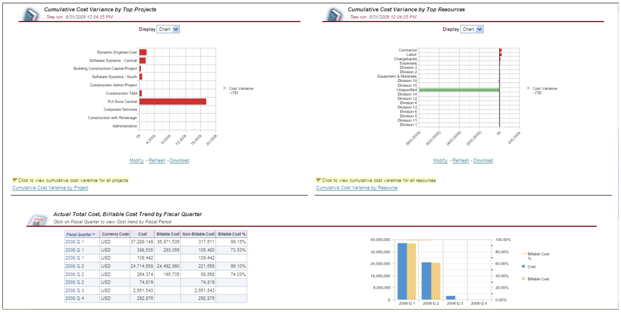
Cumulative Cost Variance by Top Projects Displays (Chart or Table) ITD cost variances for your top projects. You can view this information for all projects via Cumulative Cost Variance by Project. Cumulative Cost Variance by Top Resource displays variances for top resources. All resources may be viewed via Cumulative Cost Variance by Resource.
Actual Total Cost, Billable Cost Trend by Fiscal Quarter displays Cost, Billable Cost, Non-Billable Cost, and Billable Cost Percentage by quarter. In addition, you can click on the Fiscal Quarter to view Cost Trends. This information is displayed in tabular and graphical formats.
You can drill through Cumulative Cost Billability by Project, Cumulative Cost Variance by Project, People Effort Trend by GL Period, Cumulative Cost Trend by Fiscal Period, and Cost Transactions.
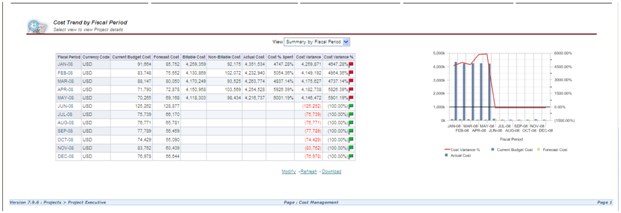
Cost Trend by Fiscal Period has two Views (Summary by Fiscal Period, Details by Project) of Current Cost Budget, Forecast Cost, Billable Cost, Non-Billable Cost, Actual Cost, Cost Percentage Spent, Cost Variance, and Cost Variance Percentage. The information is displayed both in tabular and graphical formats.
2.4 – Revenue Management
Provides detailed Revenue, Billing, and Funding information for the organizations and the projects under the organizations with the ability to drill down to projects, tasks, and resources. In addition, it provides revenue, billing, and funding comparisons of organizations, customers, and programs, and revenue performance by top projects and top customers, including trending, with the ability to drill down to details.
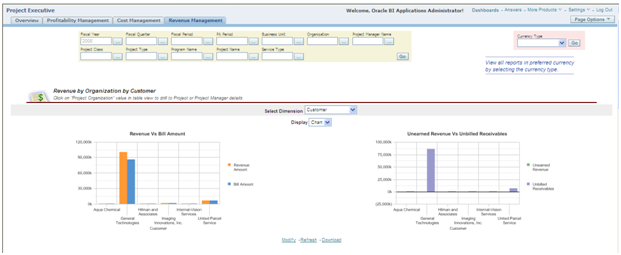
Revenue by Organization by Customer uses Dimensions (Customer, Revenue Category, Project Organization, and Program) to Display (Charts or Tables) to compare Revenue to Bill Amounts. For example, you can click on Project Organization to drill to Project or Project Manager details in the table format. Unearned Revenue vs. Unbilled Receivables shows these amounts by the dimension selected.
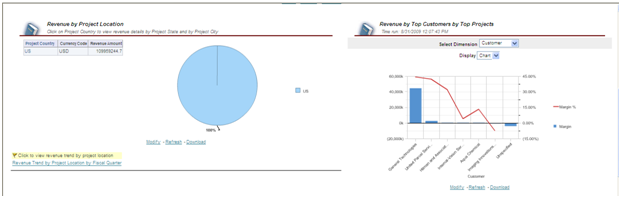
Revenue by Project Location initially displays the information by Country. Next, you can click on the Country to view Project State and City revenue details. Finally, you can drill through Revenue Trends by Project Location by Fiscal Quarter.
Revenue by Top Customers by Top Projects allows you to select Dimensions (Customer or Project Name) to Display (Chart or Table) Margin and Margin Percentage by the chosen dimension.
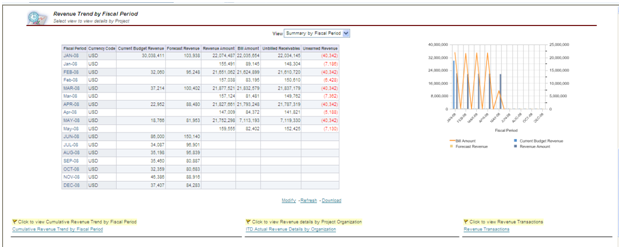
Revenue Trend by Fiscal Period allows you to choose a View (Summary by Fiscal Period or Details by Project) of Current Budget Revenue, Forecast Revenue, Revenue Amount, Bill Amount, Unbilled Receivables, and Unearned Revenue. The information is displayed in the table and graphical format. In addition, you can drill thru to Cumulative Revenue Trend by Fiscal Period, ITD Actual Revenue Details by Organization, and Revenue Transactions.
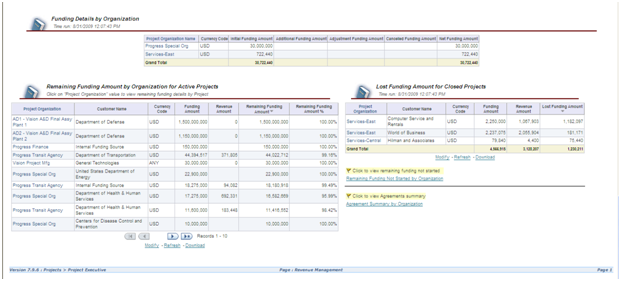
Funding Details by Organization display the Initial Funding Amount, Additional Funding Amount, Adjustment Funding Amount, Cancelled Funding Amount, and Net Funding amount by Project Organization. Remaining Funding Amount by Organization for Active Projects displays Project Organization, Customer, Funding Amount, Revenue Amount, Remaining Funding Amount, and Remaining Funding Amount Percentage in a table.
Lost Funding Amount for Closed Projects shows Project Organization, Customer, Funding Amount, Revenue Amount, and Lost Funding Amounts. You can also drill thru to Remaining Funding Not Started by Organization or to Agreement Summary by Organization.
Summary
The Project Executive area of Project Analytics provides those users whose organizations are responsible for running projects the appropriate level of visibility into the type of information they need to manage and forecast results for the enterprise effectively. And since the pages are interactive, managers can focus on the meaningful metrics to the organization and download that information as needed.
