The information below provides an overview of the reporting and metrics available in Project Analytics for Project Management. The synopses can be found on the Dashboard Index and describe each tab within the Project Management Application. Additional details on each screenshot represent elements of the metrics and functionality within each interactive dashboard page.
Project Management
Screenshots of the default dashboard for each tab within the Project Management application area are shown below. Results in the dashboards can be filtered using the parameters at the top of each dashboard. Additional query modifications are available using the ‘Modify’ link.
1.1 – Project Performance
Provides the default-aggregated view of information for all the projects satisfying the dashboard filter criteria, with the ability to drill down to specific project details. This dashboard page provides a quick overview of key performance indicators such as ITD margin %, ITD cost, and revenue variances for the group of projects or a specific project. It also provides a quick snapshot of covering the cost, efforts, revenue, billability, and billing for the group of projects or a particular project.
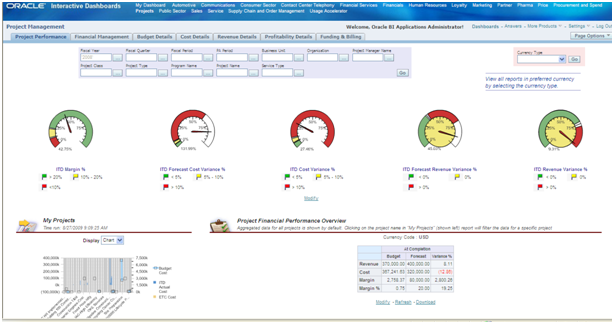
Gauges show margins, variance for costs, revenue, and forecasts. My Projects displays in chart or table format Budget, Actual, ETC costs for the user’s projects. Financial performance aggregates the data in My Projects. I was clicking on a specific project that filters all Project Performance data for that particular project.
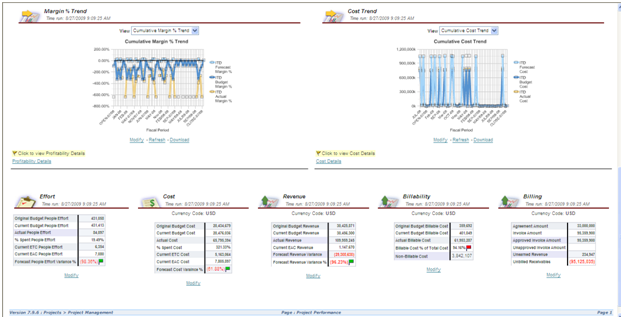
Margin Percentage Trend displays ITD Forecast, Budget, and Cost Margins over time and allows drill thru to Profitability Details. The cumulative Cost Trend shows ITD Forecast, Budget, and Cost Totals over time and provides exercise to Cost Details.
The effort, Cost, Revenue, Billability, and Billing compare the Original Budget, Current Budget, Actuals, Percent Spent, ETC; EAC, and calculate Variances using those factors.
1.2 – Financial Management
Provides the default-aggregated view of information covering the financial aspects of a group of projects or a specific project satisfying the dashboard filter criteria. This dashboard page provides a quick overview of Inception-to-date performance, variances, cumulative revenue, cost, margin, billing, and period-over-period changes and the funding summary with the ability to drill down to takes or resources, including trending.
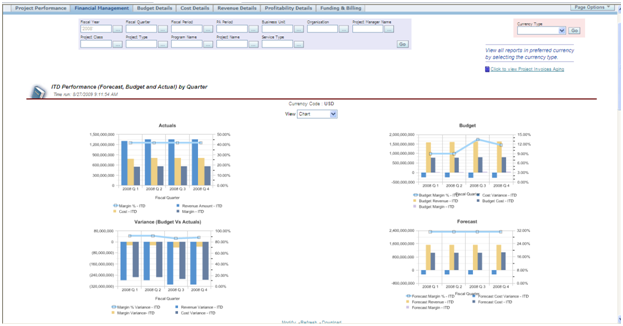
Actuals, Budget, Variance (Budget vs. Actuals), Forecast display Cost and Revenue Actuals, Budget and Forecast Amounts, Margins, and Variance all by Fiscal Quarter. If Financials Analytics is enabled, you can drill thru to Procurement and Spend Analytics.
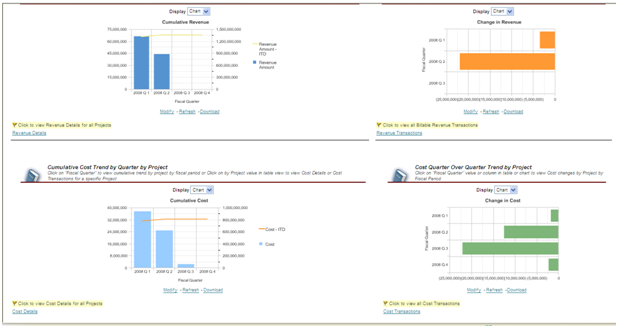
Trend views show Revenue and Cost Trends by Quarter. Further, Revenue and Costs display Quarter over Quarter Trends. So drilling thru to Cost and Revenue Details and Cost and Revenue Transactions is possible from these charts (more trends follow below).
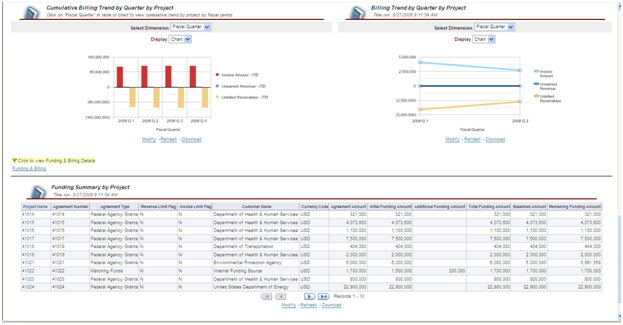
Trends: Invoice Amount, Unearned Revenue, and Unbilled Receivables are displayed by Quarter by Project. Funding Summary by Project shows Original Funding, Additional Funding, Total Funding, Baselined, and Remaining Funding.
1.3 – Budget Details
Provides detailed budget information for the projects and the tasks under the projects with the ability to drill down to child tasks and resources. In addition, it gives the budget accuracies for cost and revenue, budget changes compared to original budgets, including trending and other details.
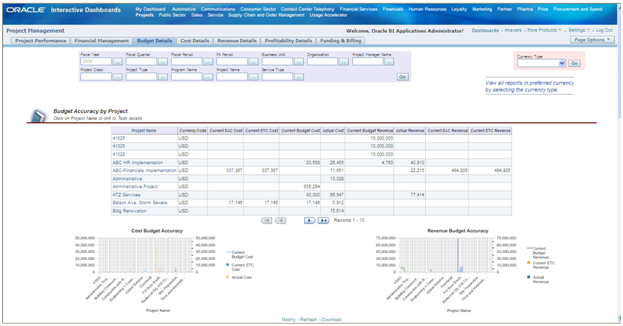
Budget Accuracy by Project displays EAC, ETC, Current Budget, Actual Costs, and Actual Revenue amounts. Clicking on a project allows the task to drill down. Cost Budget and Revenue Budget Accuracy chart amounts. You can also drill thru to Budget Accuracy by Financial Resource.
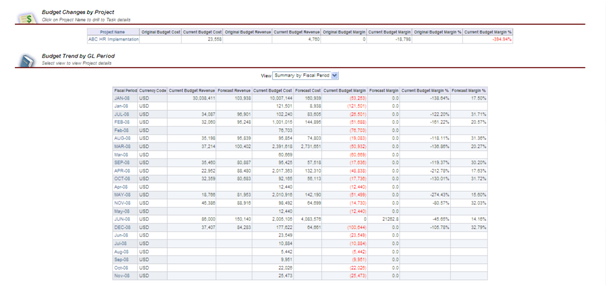
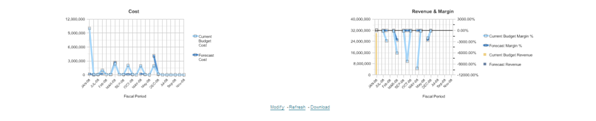
Budget Trend by GL Period displays Current Cost and Revenue Budgets, Forecasts, Budget Margins, and Forecast Margins. Amounts are charted below the table. In addition, you can drill thru to Cumulative Budget Trend by GL Period and Budget Transactions.
1.4 – Cost Details
Provides detailed cost information for the projects and the tasks under the projects with the ability to drill down to child tasks and resources. In addition, it gives the cost comparisons of employees, job codes, tasks, and other resources, including trending and further details.
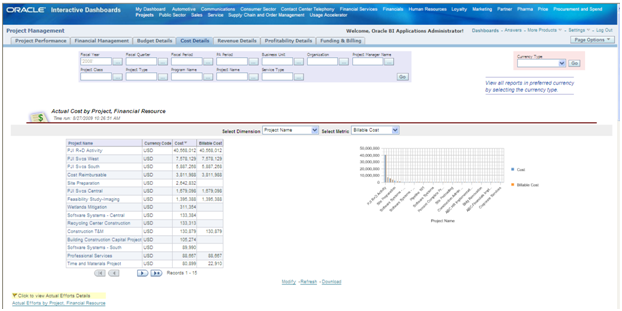
Actual Costs by Project and Financial Resources show total Costs and Billable Costs by the project. These amounts are charted as well. In addition, you can drill thru to Actual Efforts by Project, Financial Resources.
Dimensions include Project Name (shown), Expenditure Category, Resource Type, Top Level Task Name, and Supplier Name. Metric includes Billable Cost, Non-billable Cost, and Capitalizable Cost.
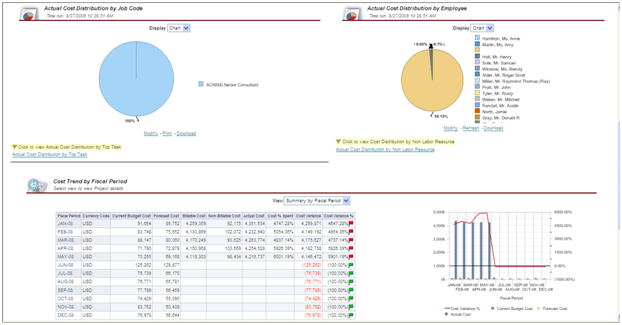
Actual Cost Distribution by Job Code can be displayed in a Table Chart. This is also true for Actual Cost Distribution by Employee (named Person).
Cost Trend by Fiscal Period displays Current, Forecast, Billable, Non-billable, and Actual Costs, along with Cost Variance and Cost Variance Percentage. Amounts are charted as well.
Drill thru is possible to Cumulative Cost by Fiscal Period, Cumulative Cost Billability by Project, Cumulative Cost Variance by Project, People Effort by GL Period, and Cost Transactions.
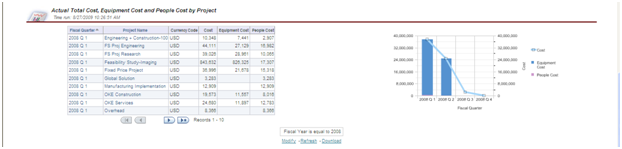
Actual Total Cost, Equipment Cost, and People Cost by Project break this cost out by the project. Amounts are charted as well.
1.5 – Revenue Details
Provides detailed revenue information for the projects and the tasks under the projects with the ability to drill down to child tasks and resources. In addition, it includes revenue comparisons of employees, job codes, tasks, and other resources, including trending and further details.
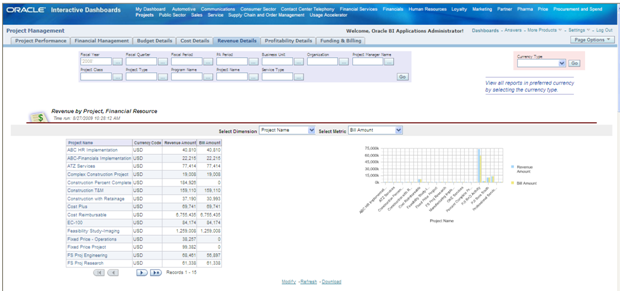
Revenue by Project, Financial Resource displays Revenue and Bill amounts by the project. Amounts are also charted.
Dimensions include Project Name, Resource Type, Top Task Level Name, Revenue Category, and Customer.
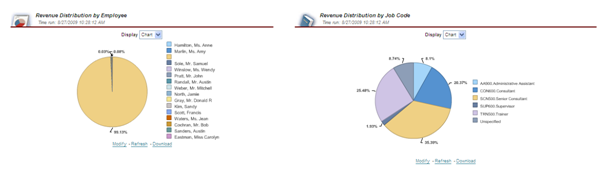
Revenue Distribution by Employee charts each Employee’s percentage of revenue. Revenue Distribution by Job Code charts revenue contribution by Job Code.
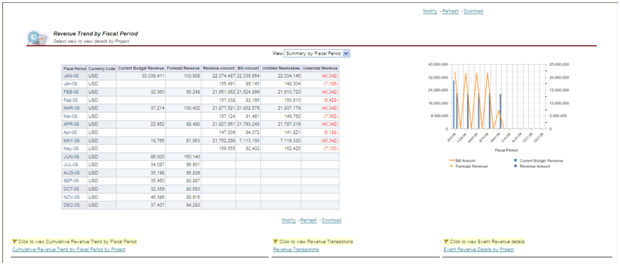
Revenue Trend by Fiscal Period displays Current Budget Revenue, Forecast Revenue, Revenue Amounts, Bill Amounts, Unbilled Receivables, and Unearned Revenue by Project. Some of these are charted as well.
You can drill through Cumulative Revenue Trends by Fiscal Period, Revenue Transactions, and Event Revenue Details by Project.
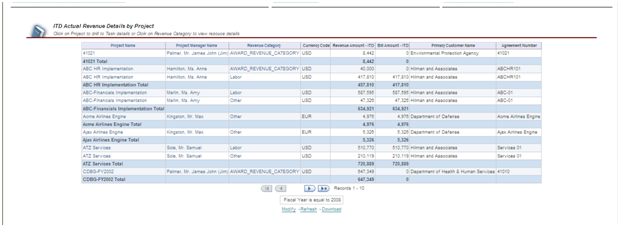
ITD Actual Revenue Details by Project shows revenue, and Bill Amounts by Project, Project Manager, Revenue Category, Primary Customer, and Agreement Number
1.6- Profitability Details
Provides detailed profitability information for the projects and tasks under the projects with the ability to drill down to child tasks and resources. In addition, it gives comparisons of the profitability to the budgets and forecasts and period-over-period changes in the margin, including trending and other details.
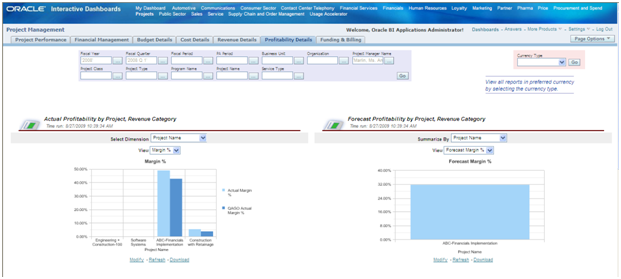
Actual Profitability by Project, Revenue Category displays Actual Margin compared to QAGO Actual Margin by the project. In addition, the forecast Margin displays forecasts by the project.
Dimension includes Project Name, Expenditure Category, Revenue Category, and Job Name. In addition, the view consists of Margin Percentage, Margin, Revenue Cost, and Data.
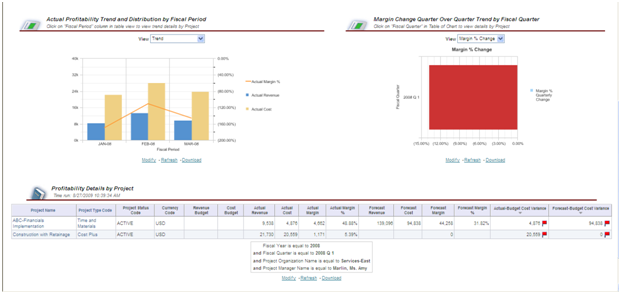
Actual Profitability Trend and Distribution by Fiscal Period show Actual Margin Percentage, Actual Revenue, and Actual Costs. In addition, the view includes Trend, Revenue Distribution, Cost Distribution, Margin Distribution, and Data.
Profitability Details by Project displays Revenue and Cost Budget, Actual Cost, Actual Revenue, Actual Margin, Actual Margin Percentage, Forecast Revenue, Forecast Cost, Forecast Margin, Forecast Margin Percentage, Actual/Budget Cost Variance, and Forecast/Budget Cost Variance by Project.
1.7- Funding & Billing
Provides the funding and billing details for a project or a group of projects and the tasks under the projects. In addition, it gives the overview of the agreement amount, funding amount that is assigned to a project, revenue amount that is accrued, invoice amount that is billed, funding changes, and the remaining funding that alerts the organization of the potential capacity or efficiency problem.
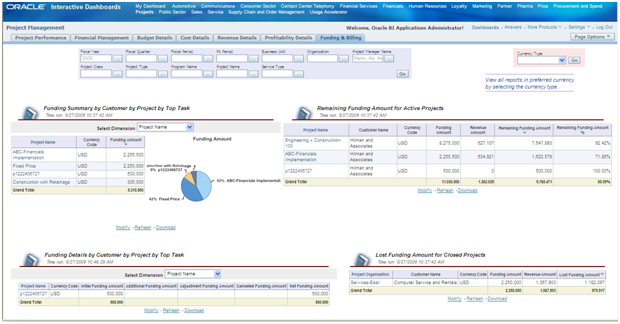
Funding Summary by Customer by Project by Top Task shows Funding Amounts by the following Dimensions: Project Name, Top Task, and Customer Name. Amounts can be graphically displayed as well.
The remaining Funding Amount for Active Projects displays the Funding Amount, Revenue Amount, Remaining Funding Amount, and Remaining Funding Amount Percentage.
Funding Details by Customer by Project by Top Task show Initial Funding, Additional Funding, Adjustment Funding, Cancelled funding, and Net Funding by the following Dimensions: Project Name, Top Task, and Customer Name.
Lost Funding for Closed Projects shows Funding Amount, Revenue Amount, and Lost Funding for closed projects. Includes Project Organization.
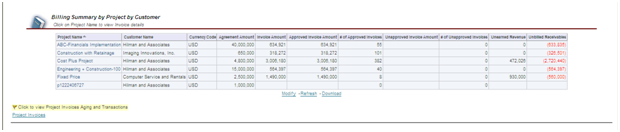
Billing Summary by Project by Customer shows Agreement Amount, Invoice Amount, Approved Invoice Amount, Number of Approved Invoices, Unapproved Invoices Amount, Number of Unapproved Invoices, Unearned Revenue, and Unbilled Receivables by Project and Customer.
Hidden Dashboard Pages
By default, the hidden Dashboard Pages do not display within their application area. They can be added to the application area. The invisible pages below contain Transaction Details
1.8- Cost Transactions
Provides detailed cost transactions at expenditure date and item level for a given project and resource. This dashboard is designed to provide weekly or daily cost transaction reports.
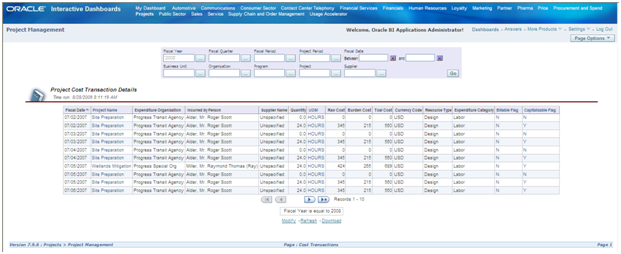
Project Cost Transaction Details displays cost data by Fiscal Date, Project Name, Expenditure Organization, Incurred by Person, Supplier Name, Quantity, UOM, Raw Cost, Burden Cost, Total Cost, Currency, Resource Type, Expenditure Category, Billable Flag, and Capitalizable Flag. All Data may be displayed or can be sorted. Filters can be used to refine the data displayed. Data can be downloaded to Excel.
1.9- Revenue Transactions
Provides detailed revenue transactions at expenditure date and item level for a given project and resource. This dashboard is designed to provide weekly or daily revenue transaction reports.
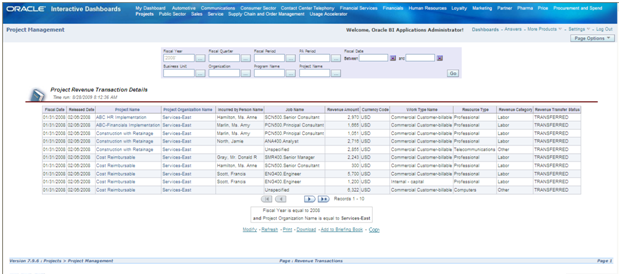
Project Revenue Transaction Details displays data by Fiscal Date, Project Name, Project Organization, Incurred by Person, Job Name, Revenue Amount, Currency, Work Type, Resource Type, Revenue Category, and Revenue Transfer Status. All Data may be displayed or can be sorted. Filters can be used to refine the data displayed. Data may be downloaded to Excel or saved to a ‘Briefing Book,’ either statically or in an updatable format.
1.9a – Budget Transactions
Provides detailed budget transactions at budget type, version, and budget period level.
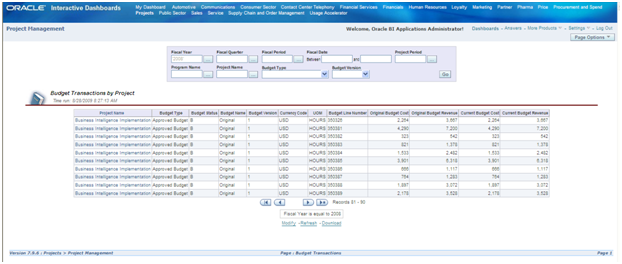
Budget Transactions by Project display data by Project Name, Budget Type, Budget Status, Budget Name, Budget Version, Currency, UOM, Budget Line, Original Budget Cost, Original Budget Revenue, Current Budget Cost, and Current Budget Revenue. All Data may be displayed or can be sorted. Filters can be used to refine the data displayed. Data may be downloaded to Excel.
Summary
The information above should provide the reader with sufficient information on the Project Management application area within Project Analytics to know about the breadth of the reporting capabilities for that part of Project Analytics.
Next Up: Please return soon for the following Project Analytics summary blog, this time for Project Executives.
